Note – please see our update Pareto chart excel template here.
The Pareto Principle (also known as the 80/20 rule) states that in many situations, a small number factors will influence a given outcome the most, even when there are many more factors in the equation. For example, a student’s likelihood of getting into college will be (mostly) determined by two things: high school grades and standardized testing scores. Books have been written about all the factors that affect college acceptance decisions, but the reality is that excellent grades and competitive testing scores make up the majority of the equation for most schools.
The Pareto Principle is at work everywhere, and the real goal of any Six Sigma project is to find the top two or three factors that make up the true Pareto chart for a given problem, and then control those factors to achieve breakthrough performance. It’s that simple. But finding the true Pareto chart behind a given problem can be very challenging at times.
Here is a simple Pareto chart showing reasons for arriving late to work over the past year (Excel® file) –
This is a standard format for Pareto charts – the count is noted on the left y-axis: this person was late eight times due to his alarm clock not sounding. The blue line and right-hand axis show the cumulative percentage for all reasons noted on the Pareto chart: in the case, the top two causes (alarm clock not sounding and sleeping through the alarm) account for 73% of the reasons for being late over the last year.
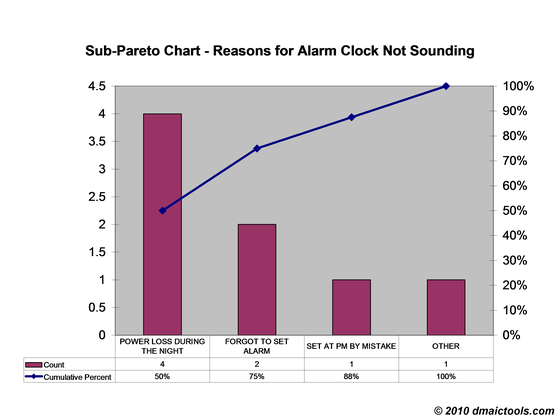
It’s very common to produce sub-Pareto charts as well. For example, in the above case it might be useful to build a Pareto chart that focuses on the reasons behind the first bar on the top-level Pareto (why the alarm clock didn’t sound). The sub-Pareto chart might look like this –
Now we are finally getting down to some actionable items, like buying an alarm clock with a backup battery in case of a power loss.
While Six Sigma projects often require more advanced methods to understand the true Pareto chart for a given problem or CTQ, there are many situations where a process has been neglected over time (i.e. not supported), and the team running the process on a daily basis truly knows the reasons behind the poor performance. We’ve seen this with scrap reduction projects – basic tooling refurbishments and preventive maintenance have reduced scrap rates by more than 80%.

